dial9 started as a tool to help understand Tokio. But it turns out that if you build a tool that can efficiently record as many events as you need to understand Tokio, you end up building everything you need to be a general-purpose flight recorder. dial9 0.5 makes this vision a reality. You can play around with a demo app here.
Migrating from 0.3 to 0.5? See the upgrade guide.
If you aren't coming from 0.3 and just want to know what dial9 is: dial9 is a flight recorder that supports the following data sources out of the box (and new data sources can be added externally):
- Tokio: poll-start, poll-stop, worker park, worker unpark, scheduling delay, and task dumps (
taskdump, Linux only) — docs, example - Heap (
memory-profiling): sampled allocations, including liveset tracking for leak detection — docs, example - Profiling (
cpu-profiling): profiler based on frame-pointer unwinding on Linux and Android with fallback to the ctimer API on containerized environments — docs, example - Tracing (
tracing-layer):tracingspans, entered and closed — docs, example. You can also create spans manually. - metrique (
metrique-sink): unit-of-work events & spans with per-request context — docs, example - Linux Kernel Resource Usage (
process-resource, Unix): RSS, page faults, and the rest ofgetrusage— docs, example - Socket Accept Queues (
linux-socket, Linux only): TCP accept-queue depth — docs, example - And more!: Any crate can provide its own source of dial9 events.
The main crate is now dial9 (was previously dial9-tokio-telemetry)
Tokio is now "just one more source" for dial9. So instead of using dial9-tokio-telemetry, your application will now depend on dial9 and enable the tokio feature.
[dependencies]
dial9 = { version = "0.5", features = ["tokio"] }
Add the source features from the table above as you need them, plus worker-s3 if you want to be able to upload traces directly to S3.
This also means that the macro is now #[dial9::main] and you can dial9::spawn a new task. To launch with the least code possible, use recorder_from_env:
use dial9::Dial9TokioHandle;
// Load configuration via environment variables:
#[dial9::main(config = dial9::recorder_from_env)]
async fn main() {
    let handle = Dial9TokioHandle::current();
    handle.spawn(async { /* wake events tracked when enabled */ }).await.unwrap();
}
The dial9 viewer now supports spans, flamegraphs, and Tokio stats across multiple trace files
The dial9 viewer does technically still work as an HTML-only webpage, but if you run it via dial9 serve and your traces are in S3 (or anywhere that implements the StorageBackend trait), the dial9 viewer can produce flamegraphs, flamegraph diffs, and Tokio stats across long time ranges and multiple hosts.
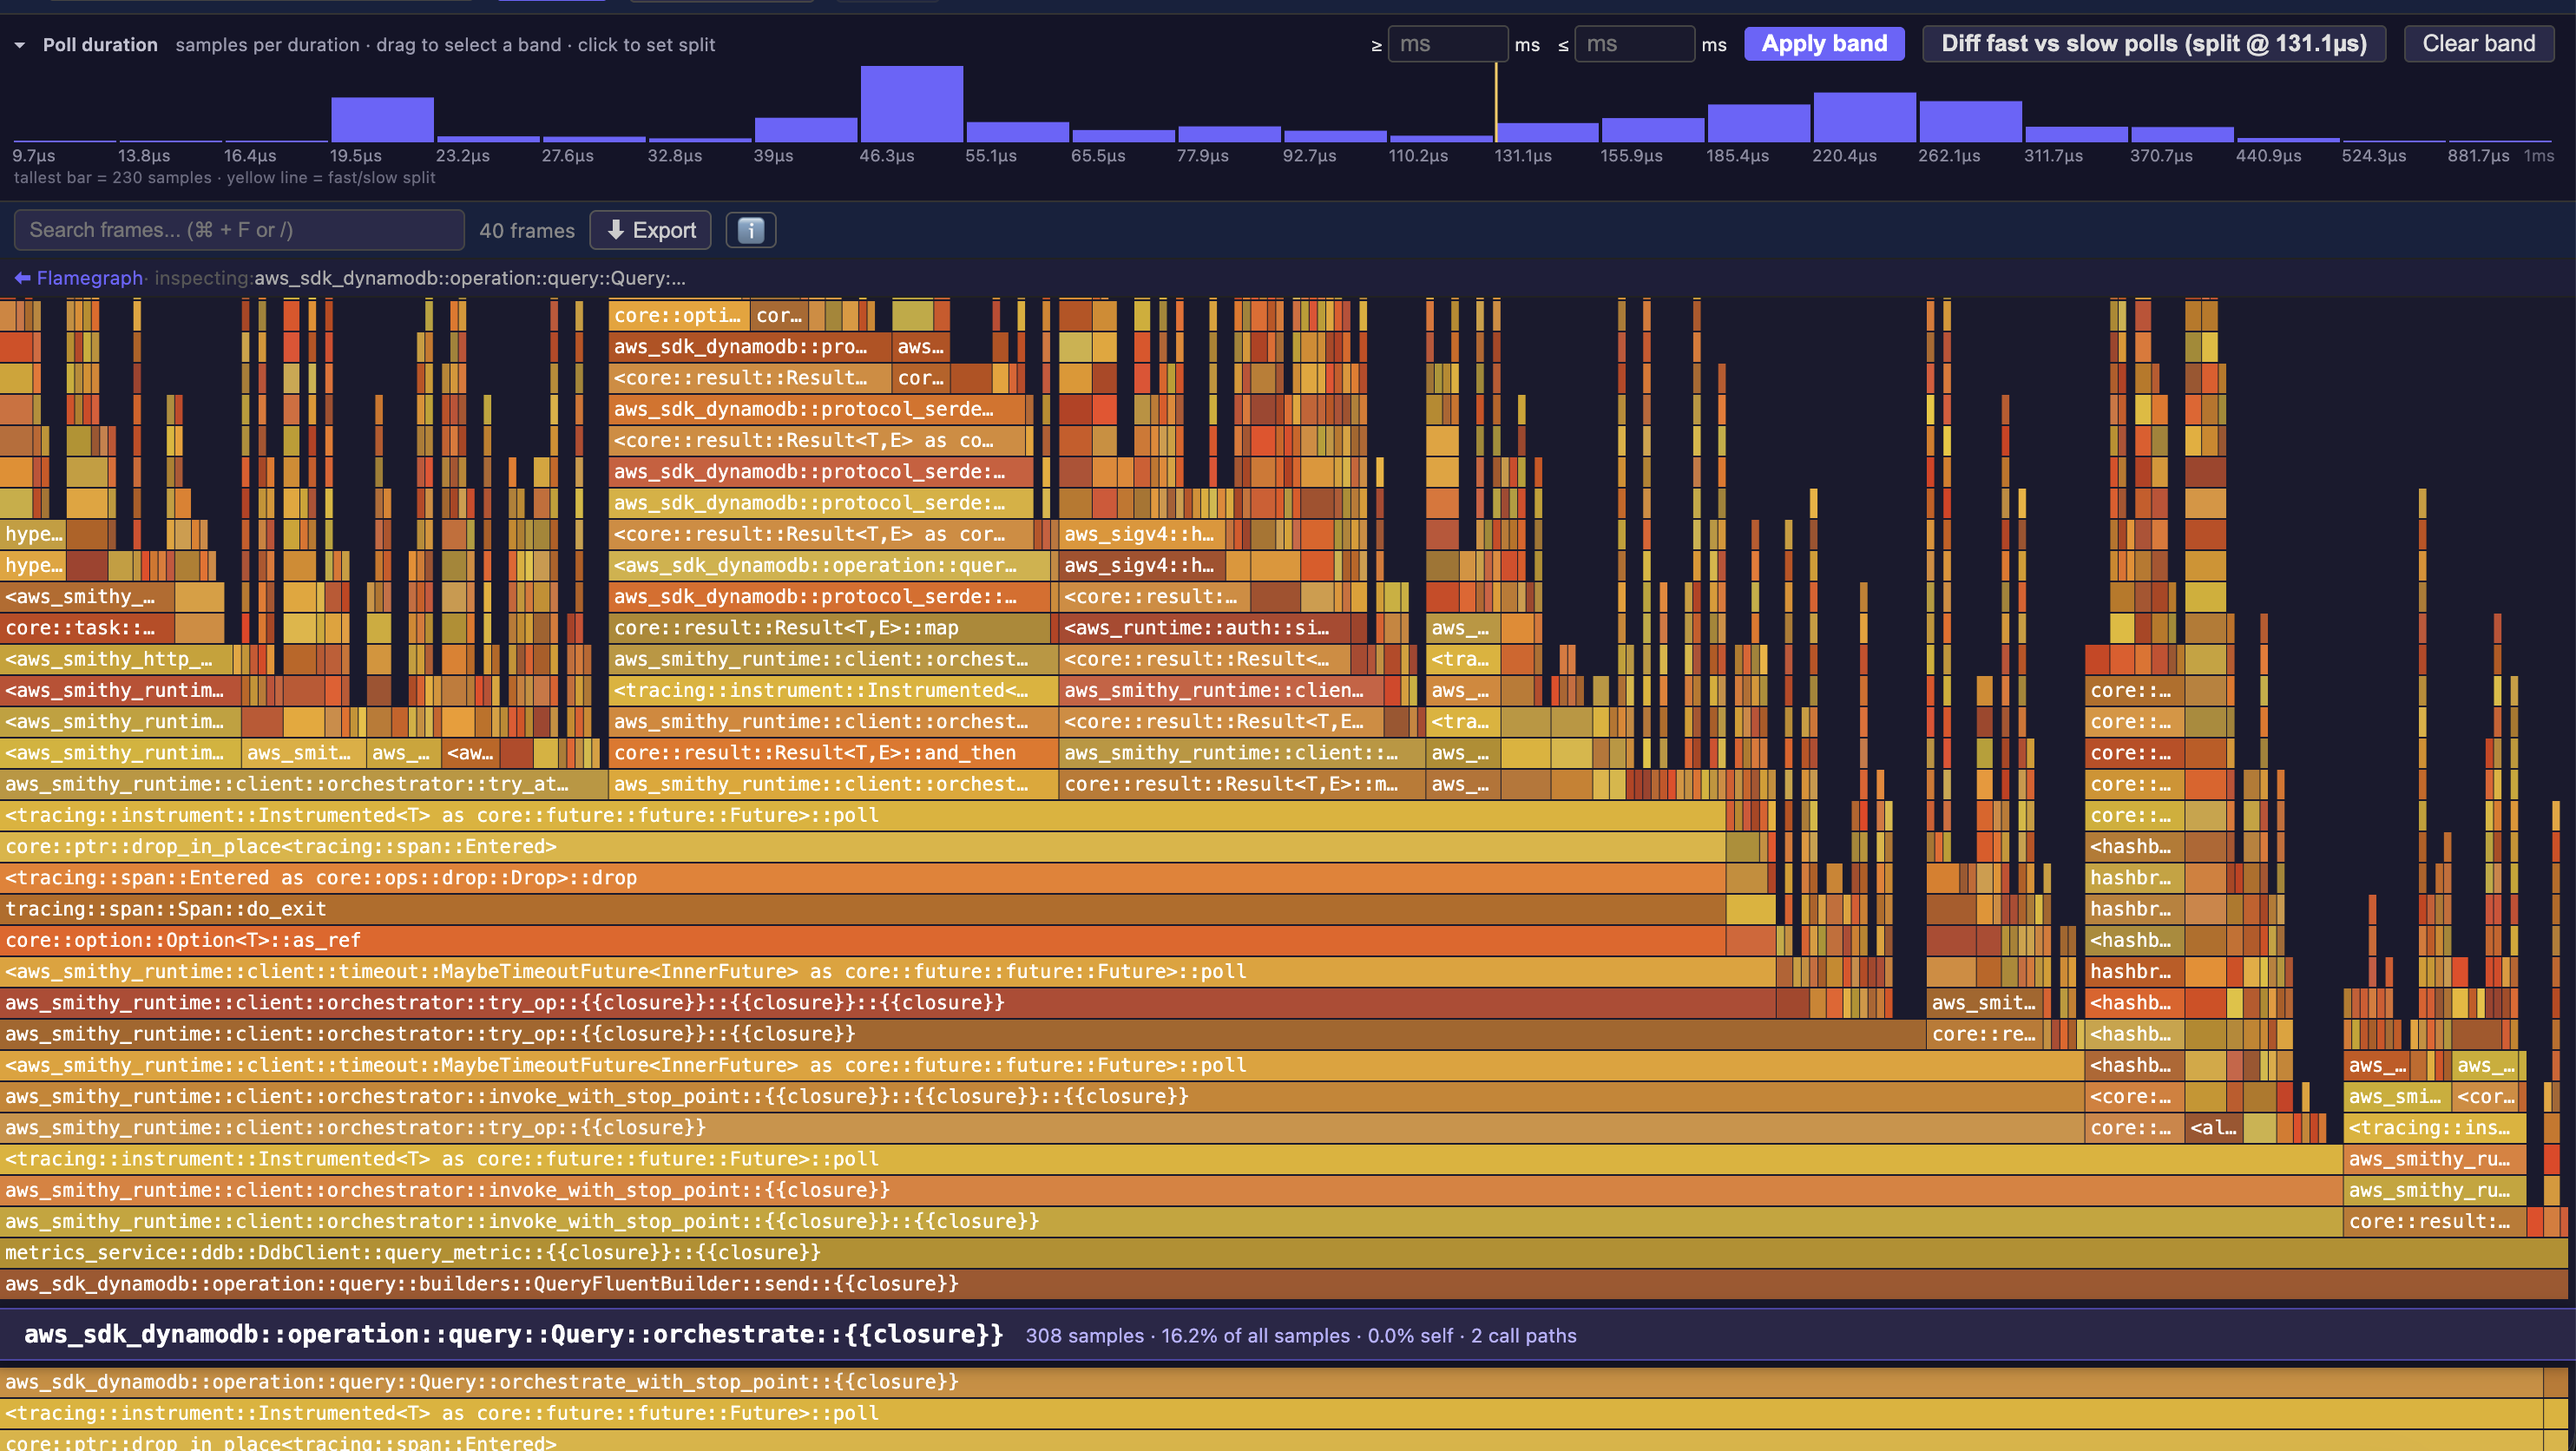
A CPU flamegraph for a DynamoDB query span, aggregated across 11 trace files. The poll-duration histogram can filter the flamegraph to a latency band or split fast and slow polls for a diff.
This works without any offline aggregation; when you open a flamegraph, it starts loading a deterministic sampling of your uploaded segments. As more segments are loaded, the flamegraph (or span histogram, or Tokio stats) will be incrementally refined, but usually, the changes after, say, 2-3% of the data is loaded are pretty minor as long as the sampling is uniform.
It's also suitable for being hosted on your own infrastructure (behind auth, of course).
And because the data all comes from raw events, you can do wild stuff like look at a flamegraph diff for a single operation when it was slow vs. fast.
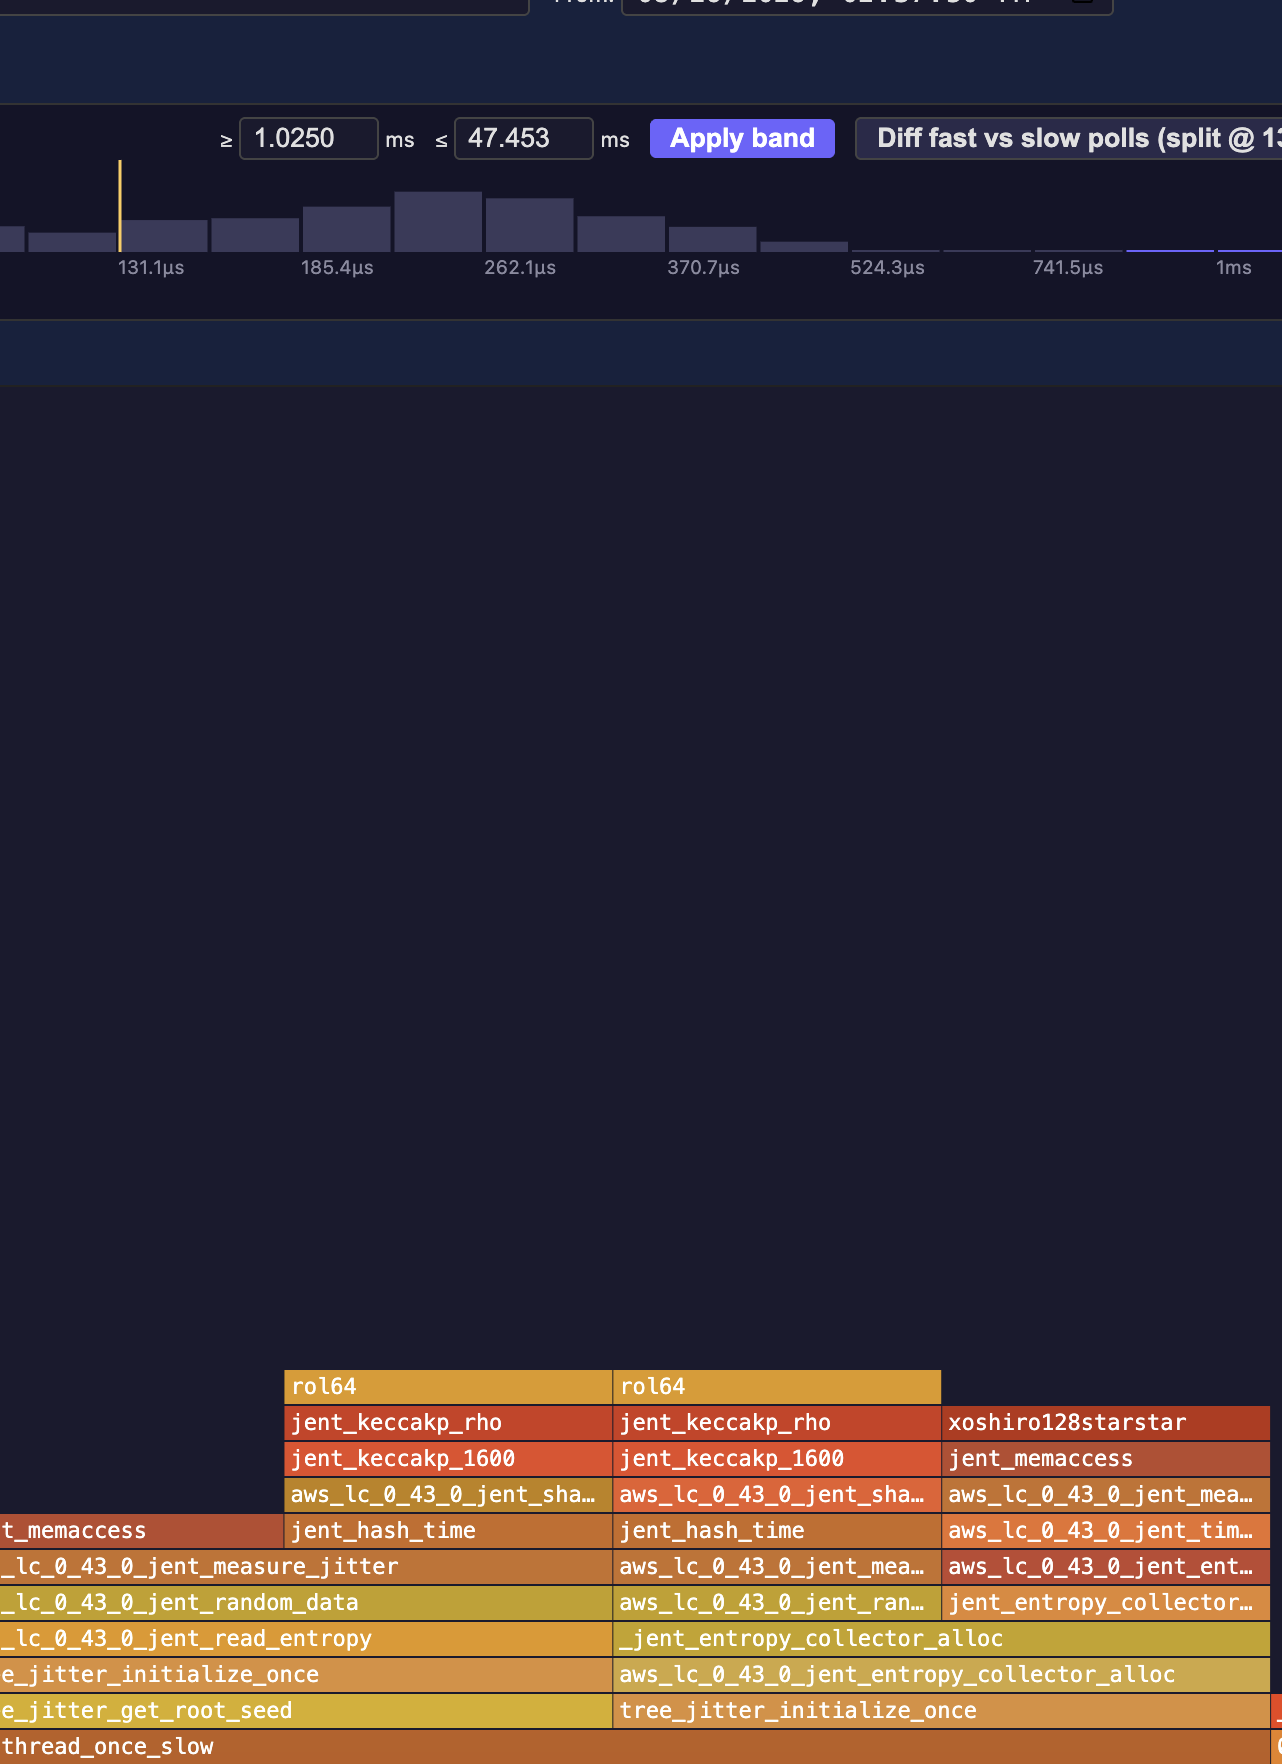
A flamegraph isolating polls longer than 1 ms. This catches AWS-LC warming its entropy pool.
cargo binstall dial9 # or `cargo install dial9` to build from source

# Aggregate over a local directory of traces
dial9 serve --local --agg-source-dir /tmp/dial9-traces

# ...or over S3
dial9 serve --local --bucket my-traces --prefix traces/ --agg(--local here means "render logs human-readably for a workstation" — the trace source is --agg-source-dir or --bucket. There's also dial9 serve --simulator if you just want to poke at a synthetic trace.)
dial9 works without tokio_unstable!
dial9 0.5 now works without tokio_unstable! Instead of failing to compile, it provides more limited Tokio-based telemetry because features like poll start/stop callbacks are unavailable.
dial9 can natively produce spans
Profiling data is useful, and span data describes timed operations in your application. When you have both side by side in the same trace, they're especially useful for debugging. dial9 0.3 supported capturing tracing spans. However, this was often cumbersome to integrate into existing applications because it required intrusive changes to their tracing subscriber. Now, you can produce spans directly from dial9:
let (load_span, slots) =
    dial9_span!("db.load_order", order_id: u64 = order_id, total_cents: u64);
let order = async {
    let order = load_order(order_id).await;
    slots.total_cents.set(order.total_cents);
    order
}
.instrument(load_span)
.await;
There is also a Tower layer for easy integration with Tower-based services:
let layer = Dial9SpanLayerWithResponse::new(|order_id: &u64| {
    let (span, slots) = dial9_span!("checkout", order_id: u64 = *order_id, status: u16);
    (span, move |status: &u16| slots.status.set(*status))
});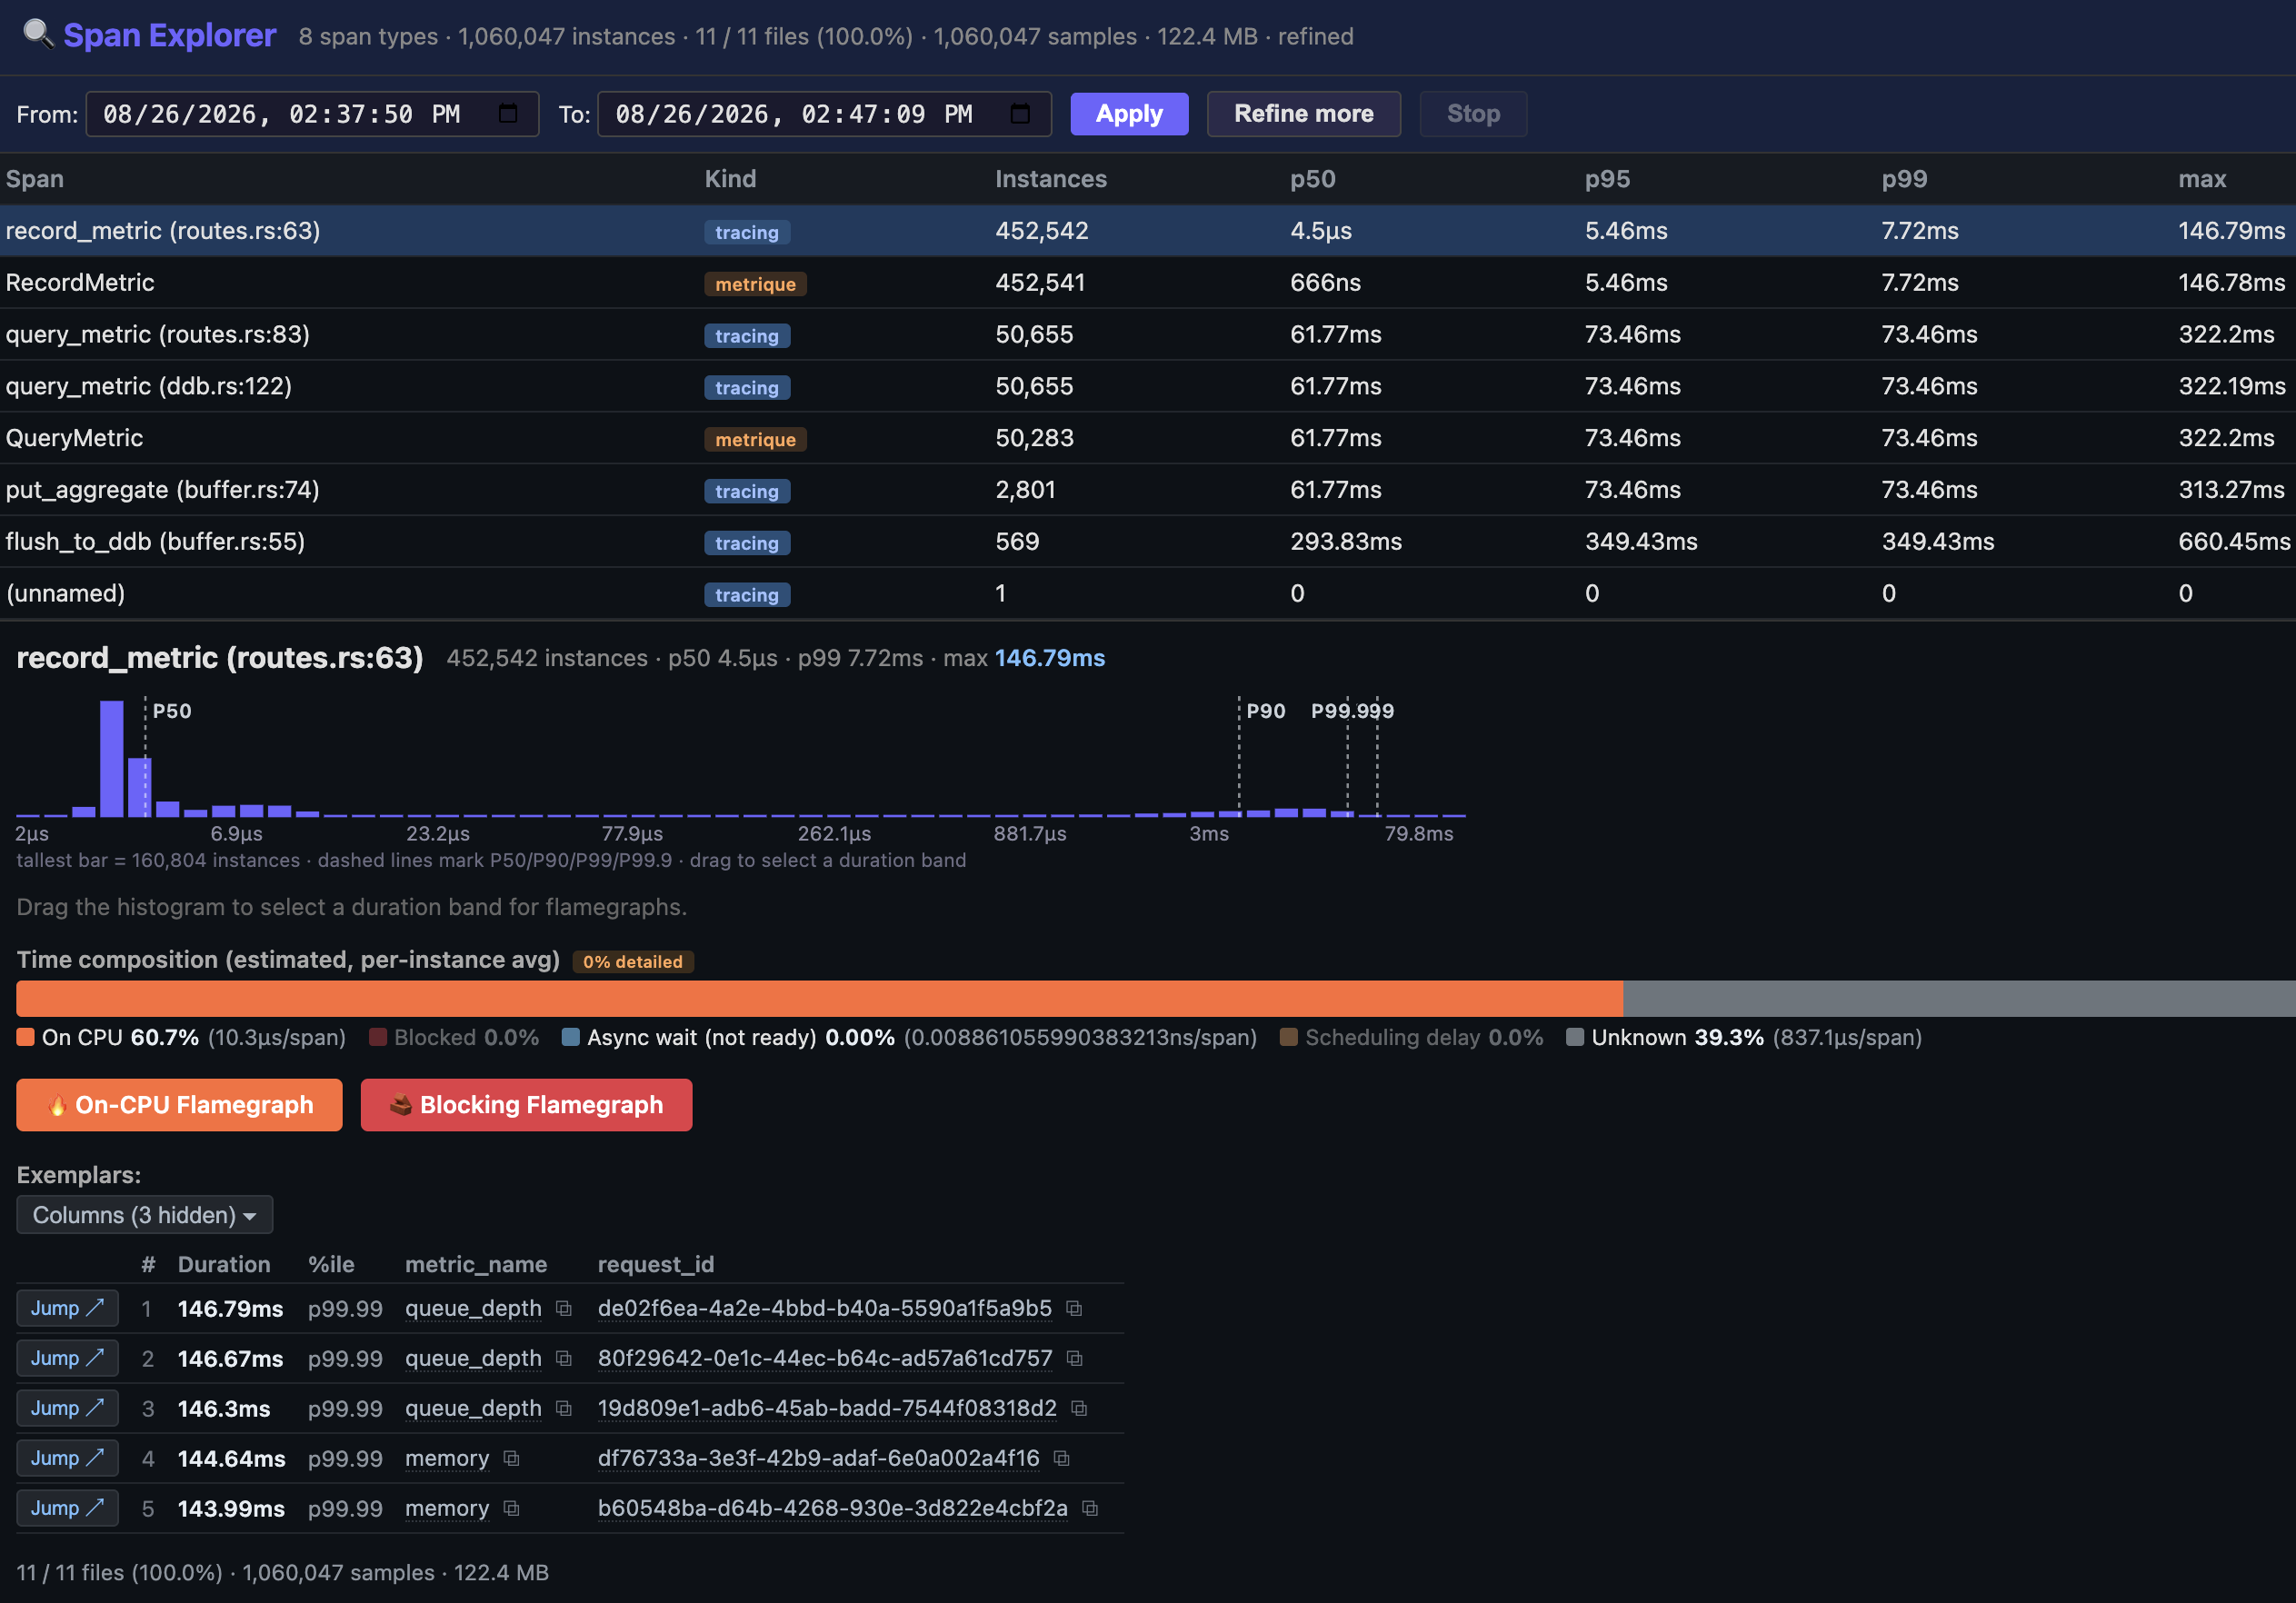
The Span Explorer summarizes every span type across the selected time range, including instance counts, latency percentiles, duration histograms, estimated time composition, and exemplar spans.
Span histograms are interactive too: select a duration band to find representative examples, then use an exemplar's Jump button to open the exact trace file containing that span.
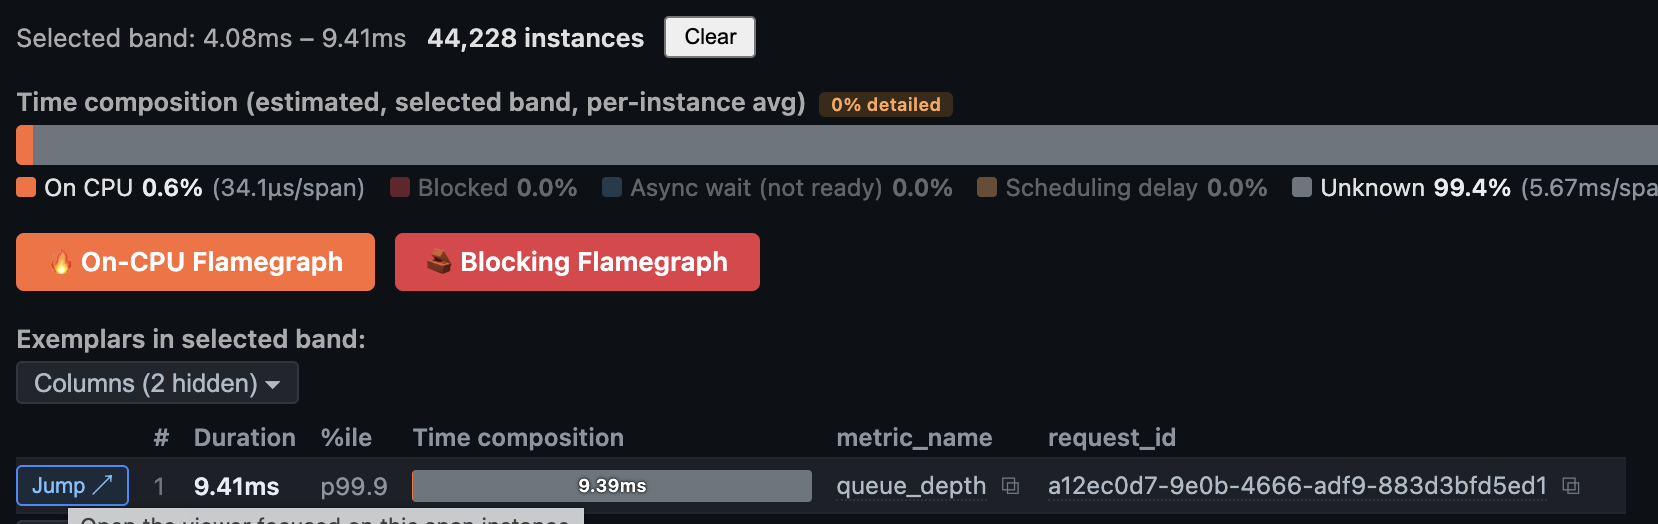
Jump directly from an aggregated duration band to the exact trace file for an exemplar span.
Trigger mode lets you upload only anomalous data
High-traffic applications using dial9 often produce more than 1 MB/second of trace data. This is a lot to store, especially if the data doesn't have anything interesting. dial9 now supports a rotating ring buffer of data that is only flushed when triggered from the application. For example, if your application hits an anomalous condition or has a sudden increase in load, you can trigger a dump to be flushed to disk, S3, or any other destination.
with_dump_trigger gates when the pipeline runs, not what it does — whatever pipeline you'd have run continuously is the pipeline a dump runs.
use std::time::Duration;
use dial9::{Dial9Handle, DiskBuffer, Dial9HandleTokioExt, RecorderPipelineExt, TokioAttachOptions};

#[dial9::main(config = || {
    let writer = DiskBuffer::builder()
        .base_path("/tmp/dial9-traces")
        .max_total_size(10 * 1024 * 1024)
        .build()?;

    let recorder = dial9::recorder(writer)
        // Whatever pipeline you'd run continuously. `with_dump_trigger`
        // only changes *when* it runs.
        .with_custom_pipeline(|p| p.gzip().write_back_to("/tmp/dial9-dumps"))
        // Coalesce a retriggering watcher's burst into one dump.
        .with_dump_trigger(|t| t.debounce(Duration::from_secs(30)))
        .build();

    let mut builder = tokio::runtime::Builder::new_multi_thread();
    builder.enable_all().worker_threads(2);
    let runtime = recorder
        .handle()
        .attach_tokio_runtime(builder, TokioAttachOptions::default())?;
    Ok((recorder, runtime))
})]
async fn main() {
    // Reach the trigger through the ambient handle from any runtime thread:
    // a monitor task, a panic hook, a `/dump` handler.
    let trigger = Dial9Handle::current()
        .dump_trigger()
        .expect("on-demand mode enabled");

    // ... your app runs; segments accumulate in the ring, pipeline stays parked ...

    // Something looks wrong: keep it.
    let receipt = trigger
        .dump_current_data()
        .with_metadata("reason", "idle-ratio-drop")
        .await?;

    println!("dump {} captured {} segments", receipt.dump_id, receipt.segments_processed);
}
See on_trigger_dump.rs and on_trigger_dump_windows.rs for examples.
In-memory buffer skips writing to disk
In-flight trace buffering has been overhauled and now has two options:
DiskBuffer: Same as dial9 0.3.0, a directory on disk holds trace files in flight prior to being uploadedMemoryBuffer: A new mode that buffers traces in memory. In practice, this does not increase memory usage since each trace needs to be loaded into memory for symbolization anyway. The only downside is that traces are not durable in the event of an application panic or crash. This is the recommended mode for most applications.
CPU profiling now works on Android!
Thanks to @nickrobinson for landing an upstream PR to libc and updating dial9. dial9 now works great end-to-end on Android! Android needs special handling because the Android runtime owns SIGSEGV through libsigchain, so the PR adds the platform-specific signal and context handling needed for safe frame-pointer unwinding. It's been running at Ditto behind a feature flag on production Android devices.
Everything is a Source
In dial9 0.3, Tokio and CPU profilers were both deeply integrated to provide data into dial9. In 0.5 they're ordinary Source implementations on a plain Recorder, which means the profiling features no longer pull in tokio at all, and you can plug in your own source without touching dial9's internals. A Source can also contribute a stage to the segment pipeline — that's how enabling CPU profiling automatically wires up symbolization without the caller doing anything.
Memory profiling liveset tracking is now much faster
dial9's memory profiler previously wrote a sampled set of allocations and all frees into a ring buffer which the flush thread then drained. The problem was that writing all frees into one crossbeam ArrayQueue became a bottleneck for some applications. The new memory profiler uses scc on the allocator side to filter allocations prior to writing them into the ring buffer. This makes free-set tracking much more usable in production environments (but you should obviously still benchmark it for your application!) Since the size of the hash map depends only on the sampled liveset, running at very low sampling rates should result in very low performance overhead.
metrique integration for events & spans
dial9-metrique contains a Dial9Stream that can send metrique events directly to your dial9 traces (full example):
let metrics_join = ServiceMetrics::attach_to_stream(Dial9Stream::tee(
    recorder.handle(),
    LocalFormat::new(OutputStyle::Pretty).output_to(request_metrics_file),
));
Then you can emit metrics to ServiceMetrics, and the same records will go to both your main output and dial9.
Process resource usage & Socket Accept Queues (now opt-in)
Kernel resource usage sampling (RSS, page faults) is now behind the process-resource feature, and socket accept queue sampling is behind linux-socket. Note for upgraders: rusage sampling was on by default on Unix in 0.3, so if you want to keep those events you need to enable the feature explicitly.
Faster memory profiling when tracking the liveset
When tracking the liveset, the 0.3 memory profiler recorded every free into a crossbeam channel and consolidated and filtered frees that did not correspond to a sampled allocation. The new version uses an scc concurrent hash map to filter frees on the caller side. Since the map is sharded, it reduces the overhead of tracking the liveset.
Acknowledgements
0.5 would not have been possible without the hard work of many people. Special thanks to Julián Montes de Oca, Facundo Luzko, Franco Profeti, Prabhat Jain, Jason Gin, Jess Izen, Shreyas Kanjalkar, fmzbl, Conrad Meyer, David Tolnay, Kevin Bowling, Marc Bowes, Nick Robinson, Scriptize, houseme, mitchsw, Daniel Henry-Mantilla, and heihutu.
Where is dial9 0.4?
Some internal crates were already on 0.4 during the 0.3 release series. We decided to move all crates to 0.5 to have a uniform crate layout.